Life History Evolution
Oct 27 - Dr. Tutku Aykanat
- Trade-offs and variations in Life History Adaptations (we learned about thes in the Evolutionary Ecology lecture from Marjo, Sept 9)
- Adaptations strongly linked to an organisms growth, development, survivorship and reproduction, and especially to the timing of these events.
- Seeks to explain organisms' strategies in allocating energy between reproduction and growth events:
!LifeHistoryEvoliution, p.2
Salmon Example
- Sea age of atlantic salmon - amount of time they spend in the sea growing more rapidly
- If they stay at sea for longer, they can grow bigger (3 sea winters ~ 15 kg). This allows males to outcompete other males and females to carry more eggs
- If they return earlier - they are more likely to reproduce before they die at sea and can reach smaller tributaries to spawn, places that are not accessible to other salmon
"Sneaker" strategy (exam question on this)
- Sometimes, very small male salmon can produce sperm and fertilize eggs - a "sneaker" strategy. They don't even travel to the ocean. They just sneak up to the female's eggs and fertilise them without even competing with the other males. It's unclear whether they can still survive to reproduce further after this event.
- Read this study for more info:
- Lepais et al 2017 - Genetic architecture of threshold reaction norms for male alternative reproductive tactics in Atlantic salmon (Salmo salar L.)
Genetic basis
- Two genetic regions that are highly associated with this were identified
- These same genetic regions are also important for local adaptation (differ from Hardy-Weinberg Equilibrium)
- What are the cellular and organismal patterns and ecological processes that lead to this?
Energetic constraints
- These are central to these discussions, for example less available energy (resources) could result in changing optimal reproductive age or number of offpsring
Fitness Strategies
Two major components of fitness: survival and fecundity
- Events such as development, maturation, reproduction and death
Optimal life history
- Darwinian Demon example: This organism would live forever, begin breeding at birth and produce infinite number of offspring
- In this case, there are no biological constraits on these traits. In reality, organisms need to choose certain life history traits to maximize based on what produces optimal fitness within their environment.
Antagonistic Pleiotropy
- Adaptations that result in higher fitness in early life but negative effects with age
- In theory, this should be a direct negative correlation (trade-off)
- Examples are sickle-cell anemia or alzheimer's - these genes can offer advantages in early life but negative effects later
- Different species might have a different survival-reproduction curve. Humans have a convex curve, with high survivorship until late in their lifespan. Crocodiles and fish have a concave curve - many die in the very beginning of their life cycle, leaving few survivors to reproduction.
Cost of Reproduction
- Species have adapted various strategies to maximise their fitness
- Salmon for example are largely semelparous - invest heavily in one reproductive event
- (although atlantic salmon can be iteoparous)
Semelparity vs Iteoparity
- Reproductive effort for each episode is lower in iteoparous vs semelparous
- For example - annual plants invest heavily in their one reproductive episode (semelparity), perennial plants invest less in multiple (iteoparity)
Iteoparity in Atlantic Salmon
- In the last 30, 40 years there has been an increase in iteoparous salmon sampled in the Teno River (individuals that have reproduced more than once)
- Has something in the environment changed to allow this?
- Maybe related to government hatcheries that release large amounts of salmon into the river
- This is correlated with higher iteoparity - after removing the eggs from the salmon, they recondition them in warmer tanks before releasing them, this results in higher survivorship
Ecological Differences inducing changes in life-history traits
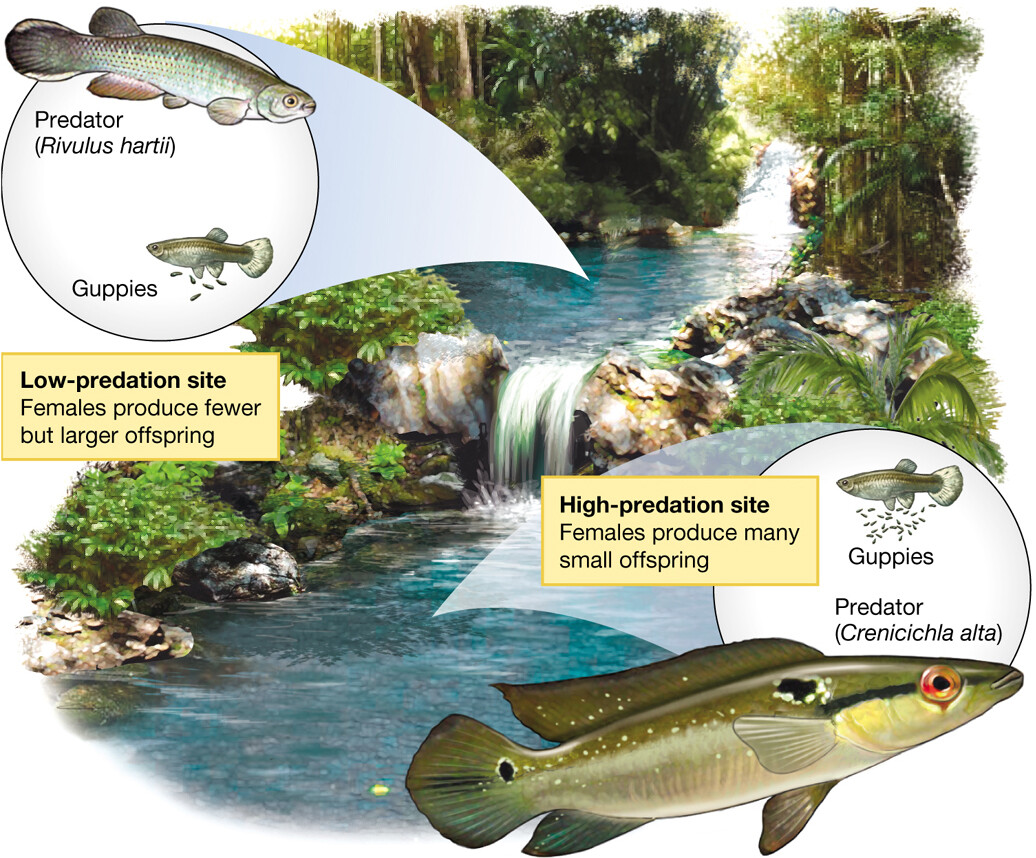
- Trinidadian Guppies are a good example:
- Islands containing waterfall streams
- Above the waterfalls there are low-predation habitats
- Larger, more colorful, less offspring
- Individuals also mature slower in low-predation environments. This is a trade-off between fitness of offpsring and age of maturity?
- Below there are high-predation habitats
- Smaller, less colorful, more offspring
- In a common garden experiment, individuals adapted to the low predation environment are less sensitive to high population density then ones from the high-predation environment - this is because they are more adapted to living in higher-density environments.
Life Tables for measuring fitness
- Includes age (x), cumulative survival probability until age x, reproductive output at this age.
- Related to Population Ecology (Marjo's lecture from Sept) / Population Dynamics (Eco-Evo intro lecture)
- Probability model for an entire population or species - based on variables like survival probability, age-specific fecundity intrinsic growth rate
- When intrinsic growth rate
is 0, there is no change in absolute fitness of the population and it "senesces", meaning to evolutionary change will occur. - Quantitative Genetics models
- Read this textbook chapter for more: Ecology For All - Population Modeling
!LifeHistoryEvoliution, p.4
Life-history evolution class activity
Task 1 - Differences in hen egg laying in different strains of hens:
- Some hens are more adapted to lay a lot of eggs when they're young, but much less as they age, and some to lay more throughout their lives.
- This shows the physiological limits in egg production even when there are no constraints.
Task 2 - Great Tit clutch size
- This is similar to the example from Behavioural Ecology lecture and assigned reading.
- The text is illegible here, here is a description:
- In the top chart, the x axis is clutch size and the y-axis is individual fitness. This is a theoretical graph just for demonstration purposes
- The concave curve in the top chart shows the effect of increasing clutch size on the parrent's fitness. The convex curve is the same effect on the offpsring born into these clutch sizes.
- A small clutch size results in high fitness for the offspring, since they will have high survival and be more likely to reproduce, but less for the parent since they will only produce one offspring per year
- A large clutch size is bad for both parents and offspring fitness. If the clutch size is too large the parent won't be able to produce so many through its entire life.
- The bottom chart shows a real example of this effect by plotting average nestling weight vs clutch size in great tit nests. The nestling weight is highest in small clutches and sharply drops off after the optimum clutch size.
Task 3 - Fish egg emergence
- Based on this study of fish emergence
- Fish depend on their yolk reserves from their mother until the spring when they start foraging. The date when they transition is called "emergence date"
- In years with average temperature, it's best to emerge in the middle of the emergence period to get the most advantage of both yolk reserves and habitat quality.
- In years with a mild winter or early spring, the fish that emerge earliest are favored since they can eat more of the available spring food. Late emergers will have less success since there will be less food when they emerge.
- The opposite happens in years with a late spring.
!LifeHistoryEvoliution, p.5
Task 4 - Something like this will be in the exam
From this paper about nematode reproduction
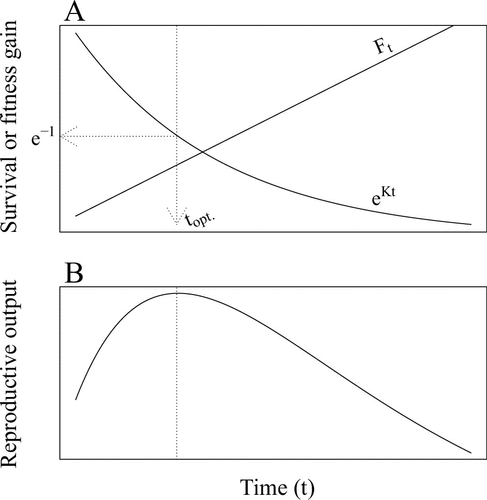
- In this model, reproductive output is correlated to survival
fitness. - Fitness increases linearly over time at rate
( ) - Survival decreases exponentially. It's related to a constant
, exposure to sources of mortality, which is always negative: - By multiplying these, we find that reproductive output is
- The derivative, using the chain rule:
- The optimal time of reproduction is when the derivative = 0 (there is no change in reproductive rate).
- There is one real solution at
. Therefore, the survivorship at this time will be
- Fitness increases linearly over time at rate
Task 5 - Optimal age at maturity for reproduction
Adapted from 1980 paper (Figure 4)
This is similar to Task 4, but about age at maturity instead of reproductive age - aren't these the same thing? Not quite sure.
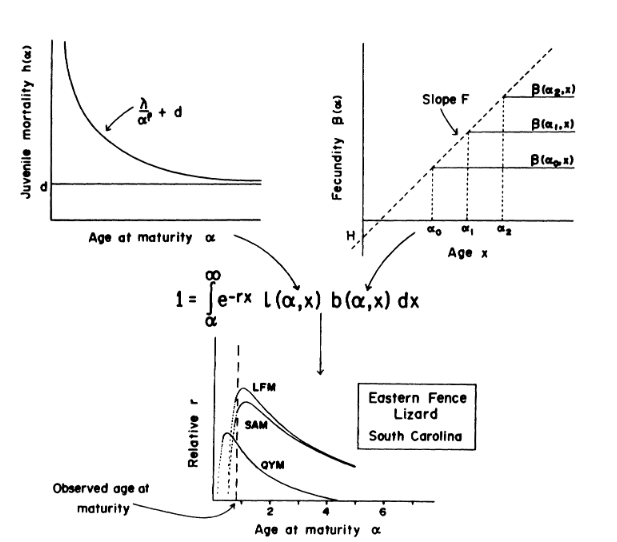
These are the assumptions behind an optimality model that is troublesome because it seems to work. We tried to predict optimal age at maturity.
Our first assumption was that organisms that delay maturity produced offspring that have lower juvenile mortality rates; this is represented by the declining curve in the graph on the upper left.
Our second assumption was that organisms that delay maturity gain fecundity linearly; this is represented by the family of straight lines depicted in the graph on the upper right.
We embedded these relationships in the Euler-Lotka equation (center), thus making the assumptions of stable age distribution and exponential population growth, then solved for the age at maturity that maximized population growth rate. The bottom graph shows the relationship of age at maturity and population growth rate for the South Carolina population of Eastern Fence Lizards studied by Tinkle and Ballinger (1972).
QYM indicates the Quality-of-Young-Model, which incorporates only the first assumption.
LFM indicates the Linear-Fecundity-Model, which incorporates only the second assumption.
SAM indicates the Salamander-Model, which incorporates both assumptions. The dashed line indicates the age at maturity that Tinkle and Ballinger observed in the field. (don't worry about this one, Tutku removed it from his chart)
Based on the linear fecundity model, optimal age should be older than the observed age.
Based on the quality of young model, optimal age should be a bit younger than what was observed. A model that combines the two (SAM) does a better job predicting optimal age.
Task 7
- This one was a bit simpler.
- In years with less food, the survival of adult great tits is higher in pairs that have fewer chicks, and decreases when they have more chicks. (negative correlation between reproduction and survival)
- In years with plentiful food, there is no change in recovery rate when they have more fledgelings. (no correlation between reproduction and survival)
- Envrionmental effects make the trade-off between adult survival and reproductive output more important.
Task 8 - survival/reproduction relation in field and lab studies - will be on exam
The textbook (Life History Evolution, Derek Roff, 2002) is available on Annas Archive.
- In the wild, it is found that there is often a negative correlation between reproduction and survival. Meaning that higher survival results in lower reproduction and vice versa.
- In lab environments, its more common for there to be no correlation between reproduction and survival.
- There was an equal number of field and lab studies that showed a positive correlation between the two.
As shown in Task 7 with the great tits, limited resources resulted in a negative corelation, but when resources were plentiful there was no correlation. Lab environments usually have plentiful resources, so the survival/reproduction tradeoff isn't is common as in the wild where there is more competition for resources.