Assignment - QTL Mapping
Part 1. Linkage mapping to find candidate genes.
Q1. How many markers are in the map and how are they distributed throughout the genome? (2)
The QTL map data contains 19,803 markers across 160 individuals and 5 phenotypes.
Q2. How many chromosomes/linkage groups are in the map? (1)
There are 30 chromosomes shown on this map.
Q3. How many different genotypes will be in the offspring of a backcross? (1)
In a backcross between Ab and bb, there are two possible offspring genotypes (Ab and bb). See the table below:
| b | b | |
|---|---|---|
| A | Ab | bb |
| b | Ab | bb |
Q4. What ratio of these genotypes do we expect to see in a backcross? (1)
We expect there to be equal frequencies of these two genotypes both around 0.5, since we don't think that there are any dominance effects involved. This corresponds roughly to our plots showing that across all 160 individuals, the genotype frequencies are all near 0.5 and not skewed towards either possible genotype.
Q5. How many markers are above the threshold when p is less than 0.05? (1)
There are 692 markers on one chromosone (9) where there is a less than 5% likelihood that we can reject the null hypothesis that there is no QTL affecting the color phenotype.
Q6. What is the position of the top marker in the genome? (1)
The top marker in the genome is at 28.9 cM on chromosome 9.
Q7. How much of the phenotypic variation in wing colour does your top marker explain? Why is it not 100%? (2)
The top marker explained 75.4% of the phenotypic variation. The reason this is not 100% is because while this is the top marker, our LOD analysis showed that there were 692 markers that had a significant effect on phenotype.
As seen in our LOD plot, there is a large spike around our 28.9 cM position, which is why these markers explain the majority of phenotypic variation, but there is a remaining 24.6% of the phenotypic variation that can be explained by the rest of the chromosome.
Q8. How many genes are within the confidence intervals? (1)
There are 21 coding genes between our confidence intervals, on chromosome 9 from markers 9400257 to 9870029.
The top marker identified earlier (at position 28.9 cM) was at marker name 9887950. This is higher than our confidence interval - the last gene in the sequence (jg6742) ends at 9870029.
This is probably because the marker identified earlier might not be part of a coding gene, it could be a neutral allele that is associated with this certain phenotype (even if it doesn't code for it). This means the gene that is closest to this marker probably codes for phenotype.
Part 2. Finding similar genes in other species
Q9. What species do you find that have very similar copies of this gene? Give some examples (1)
Based on our pBLAST job of the amino acid sequence for the gene "jg6742", identified as the closest gene to our top marker affecting coloration, all the results were other insects in the clade Endopterygota - mostly in the superorder Amphiesmenoptera containing moths, butterflies and caddisflies. This makes sense, since the genes came from a moth in this clade.
Other matches came from Hymenoptera (ants, bees and wasps) and the Polyphaga beetles.
The species with the highest scores are the moths Spodoptera litura,Spodoptera frugiperda and Helicoverpa zea.
Q10. With an internet search, what can you find out about the species with the closest matches? Are they closely related to the wood tiger moth (Same family/genus? Or more distantly related?). (1)
The three species with the closest matches are all part of the superfamily Noctuoidea - the same as Arctia plantaginis.
Unlike A. plantaginis, these three species are all also part of the same family Noctuidae, and two are in the same genus Spodoptera.
Q11. Do the results give you a clue about what the function of this gene could be? (1)
From looking at the other moths, they don't seem to be yellow, so maybe this gene doesn't code for them being yellow. It doesn't seem to tell us much about this gene other than that it occurs in other fairly closely related species.
Q12. Explain what the phylogenetic tree shows. Is it what you expected based on your earlier research of the selected species? (2)
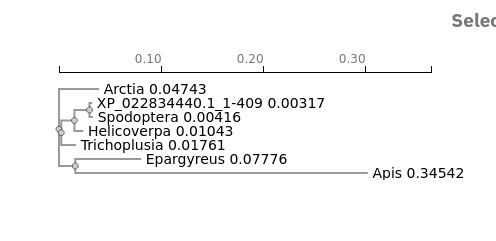
The results are similar to what I expected but not exactly.
As expected, the two Spodoptera species are in a clade together, and the clade above them containing Helicoverpa and Trichoplusia represents their shared family Noctuidae.
However, we would expect that the members of the superfamily Noctuoidea should be in a separate clade from Epargyreus and Apis which are not part of this superfamily. This is not reflected in the data - it only shows one basal clade connecting all of these taxa. Perhaps this superfamily is not based on genetic data, or the limited genome provided does not reflect the other parts of the genetic data which define this superfamily.
Apis mellifera and Epargyreus clarus are put in the same clade, but I would expect that Apis should be in a different clade, distantly related to all the other Lepidopterans since it is in order Hymenoptera. Perhaps this data is not reflected in the provided gene sequences.
Q13. Why is it useful to compare genes between species? What evolutionary questions could we use these analyses to help answer? (2)
Although looking at just one gene doesn't tell us too much about the overall taxonomic/evolutionary relation between species, it can tell us about how a gene has persisted through evolution. Even though the gene might not serve the same function, it is interesting to see which taxa still have this gene compared to ones that don't have it. We can compare the ecological roles of the species that still use this gene and see if there are similarities in function, and how natural selection has shaped these.
Q14. Choose one or two other programs and give an example of a study/research question they could be used for. Which types of data could you use with them? (2)
R2DT RNA Analysis:
This tool visualizes non-coding RNA secondary structures using RNA 2D templates. It works by inputting an RNA sequence, or a DNA sequence that codes for RNA.
Since RNA samples are easiest to collect in a lab environment, and RNA tells us about gene expression, we could collect RNA sequences from lab-reared wood tiger moths and try to determine variances in coloration gene expression.
Part 3. Finding out more about the gene function
Q15. Which gene most closely matches? (1)
The "yellow-e" gene (CG9792) most closely matches our sample.
Q16. What can we now infer about the function or evolutionary history of this gene? (2)
It seems that this gene is not very well understood in Drosophila- according to FlyBase, its molecular function is unknown. Peak expression is observed in late larval stages.
However, it is part of the Yellow- family - one gene from this family caused yellow phenotypes of adult Drosophila, similar to its observed function in tiger moths.
Other genes in the yellow family have been observed in insects, bacteria and fungi, suggesting that this gene had a very early evolution before the diversion of eukaryotic and prokaryotic lineages.
Q17. Include a picture of your tree and describe what it is showing. (2)
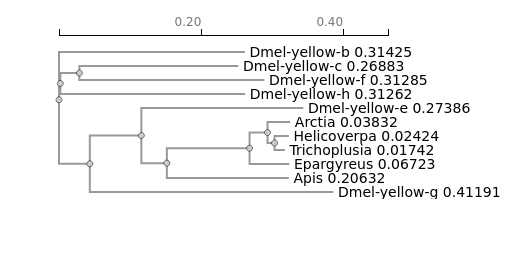
My tree shows that all of the yellow-family genes in D. melonigaster are closely related to each other but basal to all of the yellow-e genes from our BLAST on Arctia earlier. Out of all the yellow-family genes, yellow-g is the closest to yellow-e, and all the other genes are closer to each other than to yellow-e.
Q18. To conclude, describe one advantage and one disadvantage of QTL linkage mapping methods in evolutionary biology studies. (2)
- One advantage of QTL over GWAS is it has a higher statistical power at detecting causal relationships between phenotype and gene loci between controlled populations. It's very effective when you have a controlled experimental population with distinct phenotypes, like the white and yellow morphs from our case.
- A disadvantage of QTL when compared to GWAS is that it required controlled breeding, and it doesn't work as well for large diverse populations or traits that are continuously distributed (like body size).